Web Development
FinFlow - Personal Finance Tracker
FinFlow - Personal Finance Tracker
FinFlow - Personal Finance Tracker
A fully functional React web app that tracks expenses, visualizes spending patterns, and generates smart insights, built to industry standard with real data persistence.
Year :
Year :
2026
2026
Industry :
Industry :
Fintech/Personal Finance
Fintech/Personal Finance
Client :
Client :
Personal Project
Personal Project
Project Duration :
Project Duration :
2 weeks
2 weeks
Introduction:
FinFlow is a production-grade personal finance dashboard I built entirely from scratch using React. The idea came from a simple frustration - most budgeting apps are either too complex or locked behind subscriptions. I wanted to build something clean, fast, and genuinely useful that I could also use to demonstrate real frontend engineering skills.
The app runs entirely in the browser with no backend required. All data persists in localStorage, charts update in real time, and the insights engine automatically analyzes your spending patterns month over month.
Challenge:
The main technical challenge was building a meaningful analytics engine without a database or backend. All calculations - month-over-month comparisons, spending forecasts, category breakdowns and savings rate tracking - had to be derived on the fly from raw transaction data using pure JavaScript.
A secondary challenge was making the data visualization feel genuinely useful rather than decorative. Every chart answers a specific question a real user would ask.
features:
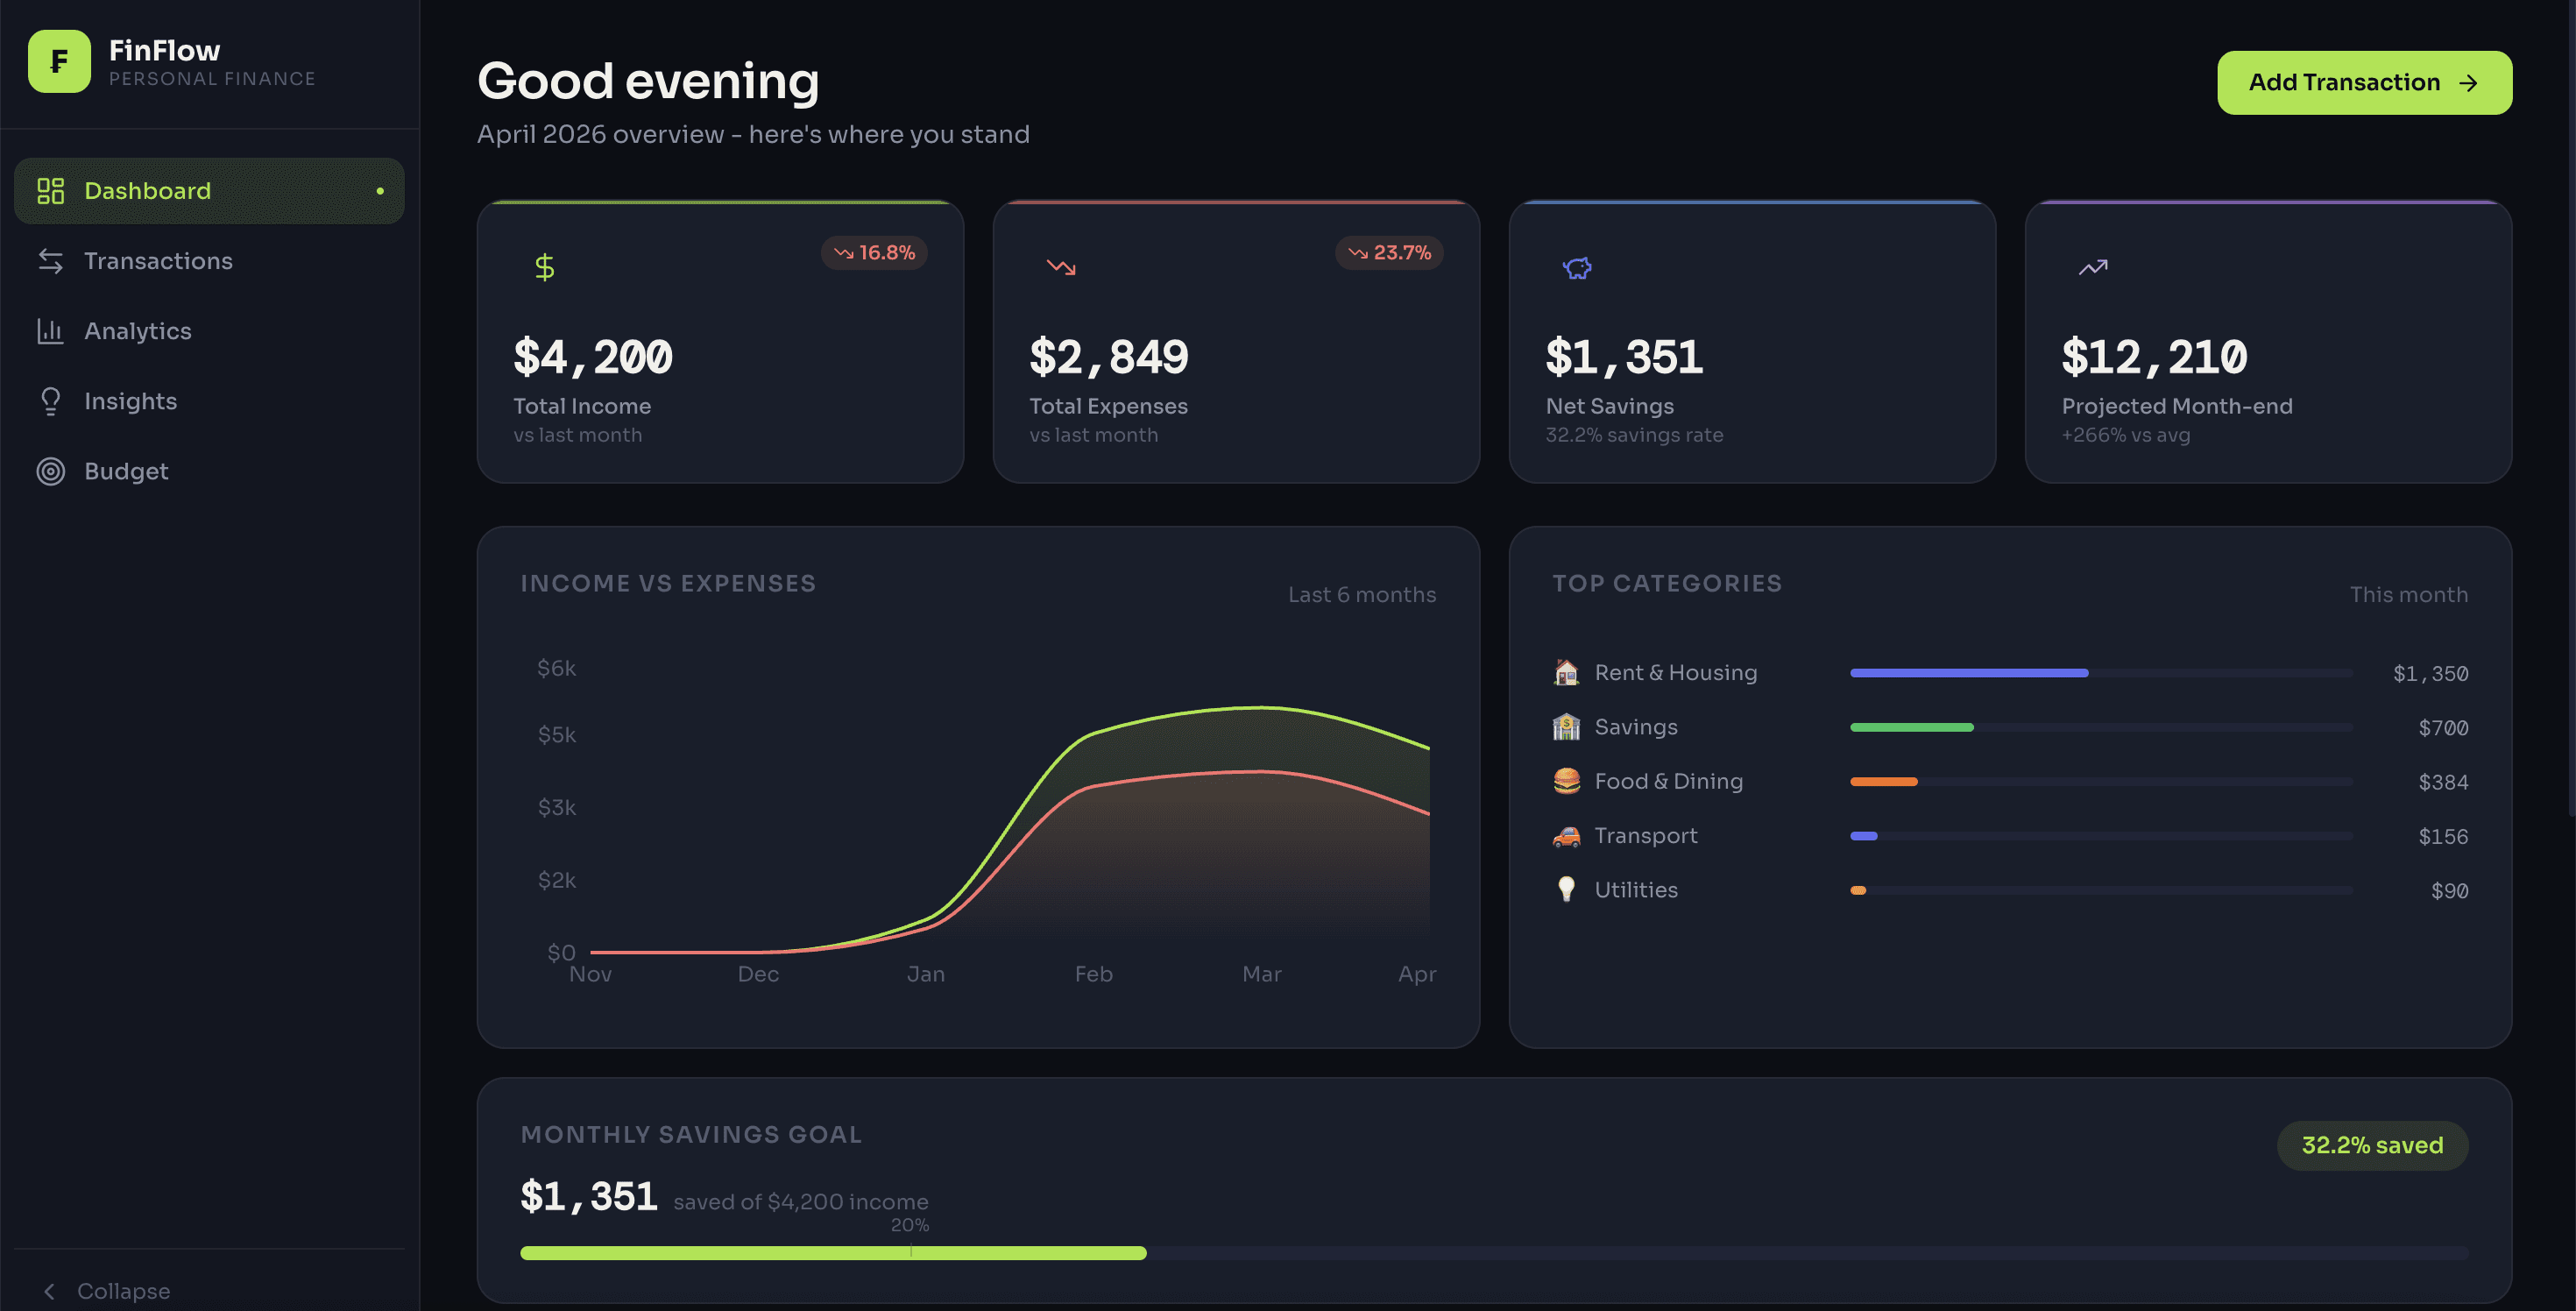
Dashboard: Monthly stat cards with trend deltas, 6-month income vs expenses area chart, top spending categories, and savings rate tracker.
Transactions: Full add, edit, and delete with search, filter by category and type, sort by date or amount, pagination, and one-click CSV export.
Analytics: Five charts including spending breakdown by category, cumulative net cash flow, monthly savings rate with a 20% target line, and a 3-month expense forecast.
Smart Insights: Auto-generated plain-English insights like "You spent 34% more on food this month" or "Fridays are your most expensive day of the week."
Budget: Per-category monthly limits with inline editing, visual progress bars, over-budget alerts, and a month-over-month comparison table.
tech stack:
React 18: Functional components and hooks throughout, no class components.
Recharts: All data visualizations. Chose this over D3 for its declarative React-native API.
date-fns: Date manipulation for all analytics calculations.
Vite: Build tool and dev server.
CSS Variables: Full design token system. No CSS framework used - everything custom.
localStorage: Client-side persistence. Swapping this for a real API would only require changing the useFinance hook.
process:
I started by designing the data model - a single transactions array with type, category, amount, date, and recurring flag. Everything else in the app is derived from that.
I built the analytics utility functions first before writing any UI, which made each component easy to build since the hard logic was already tested in isolation.
The design direction was a dark editorial theme - financial tools are used for extended periods so dark mode reduces eye strain, and it makes numbers and charts visually pop against the background.
The seed data includes 70+ realistic Canadian transactions across 3 months so the app is fully populated and usable immediately when someone opens it.
results:
Fully working app deployed on Vercel with a live URL. Every feature works end to end - add a transaction and every chart, insight, and budget tracker updates instantly. The CSV export, search, filters, and pagination all work on real data.
The codebase is structured the way a real team project would be - separated into components, hooks, and utilities - so it demonstrates not just that I can write React, but that I can organize it properly.
conclusion:
This project taught me how much you can do with just React and a well-designed data layer. The analytics engine - which generates insights, forecasts, and health scores - is entirely pure functions operating on a plain array. No library, no backend, no magic.
If I were to extend this, the next step would be Plaid API integration for automatic bank imports, which would turn this from a manual tracker into a fully automated dashboard.
What I'd Do Differently:
I'd add proper unit tests for the analytics functions from the start - they're the core of the app and the most likely place for bugs to hide as the codebase grows.
I'd also explore a lightweight backend (Supabase or Firebase) to enable multi-device sync, which is the one thing localStorage can't do.
Web Development
FinFlow - Personal Finance Tracker
FinFlow - Personal Finance Tracker
FinFlow - Personal Finance Tracker
A fully functional React web app that tracks expenses, visualizes spending patterns, and generates smart insights, built to industry standard with real data persistence.
Year :
Year :
2026
2026
Industry :
Industry :
Fintech/Personal Finance
Fintech/Personal Finance
Client :
Client :
Personal Project
Personal Project
Project Duration :
Project Duration :
2 weeks
2 weeks
Introduction:
FinFlow is a production-grade personal finance dashboard I built entirely from scratch using React. The idea came from a simple frustration - most budgeting apps are either too complex or locked behind subscriptions. I wanted to build something clean, fast, and genuinely useful that I could also use to demonstrate real frontend engineering skills.
The app runs entirely in the browser with no backend required. All data persists in localStorage, charts update in real time, and the insights engine automatically analyzes your spending patterns month over month.
Challenge:
The main technical challenge was building a meaningful analytics engine without a database or backend. All calculations - month-over-month comparisons, spending forecasts, category breakdowns and savings rate tracking - had to be derived on the fly from raw transaction data using pure JavaScript.
A secondary challenge was making the data visualization feel genuinely useful rather than decorative. Every chart answers a specific question a real user would ask.
features:
Dashboard: Monthly stat cards with trend deltas, 6-month income vs expenses area chart, top spending categories, and savings rate tracker.
Transactions: Full add, edit, and delete with search, filter by category and type, sort by date or amount, pagination, and one-click CSV export.
Analytics: Five charts including spending breakdown by category, cumulative net cash flow, monthly savings rate with a 20% target line, and a 3-month expense forecast.
Smart Insights: Auto-generated plain-English insights like "You spent 34% more on food this month" or "Fridays are your most expensive day of the week."
Budget: Per-category monthly limits with inline editing, visual progress bars, over-budget alerts, and a month-over-month comparison table.
tech stack:
React 18: Functional components and hooks throughout, no class components.
Recharts: All data visualizations. Chose this over D3 for its declarative React-native API.
date-fns: Date manipulation for all analytics calculations.
Vite: Build tool and dev server.
CSS Variables: Full design token system. No CSS framework used - everything custom.
localStorage: Client-side persistence. Swapping this for a real API would only require changing the useFinance hook.
process:
I started by designing the data model - a single transactions array with type, category, amount, date, and recurring flag. Everything else in the app is derived from that.
I built the analytics utility functions first before writing any UI, which made each component easy to build since the hard logic was already tested in isolation.
The design direction was a dark editorial theme - financial tools are used for extended periods so dark mode reduces eye strain, and it makes numbers and charts visually pop against the background.
The seed data includes 70+ realistic Canadian transactions across 3 months so the app is fully populated and usable immediately when someone opens it.
results:
Fully working app deployed on Vercel with a live URL. Every feature works end to end - add a transaction and every chart, insight, and budget tracker updates instantly. The CSV export, search, filters, and pagination all work on real data.
The codebase is structured the way a real team project would be - separated into components, hooks, and utilities - so it demonstrates not just that I can write React, but that I can organize it properly.
conclusion:
This project taught me how much you can do with just React and a well-designed data layer. The analytics engine - which generates insights, forecasts, and health scores - is entirely pure functions operating on a plain array. No library, no backend, no magic.
If I were to extend this, the next step would be Plaid API integration for automatic bank imports, which would turn this from a manual tracker into a fully automated dashboard.
What I'd Do Differently:
I'd add proper unit tests for the analytics functions from the start - they're the core of the app and the most likely place for bugs to hide as the codebase grows.
I'd also explore a lightweight backend (Supabase or Firebase) to enable multi-device sync, which is the one thing localStorage can't do.
Web Development
FinFlow - Personal Finance Tracker
FinFlow - Personal Finance Tracker
FinFlow - Personal Finance Tracker
A fully functional React web app that tracks expenses, visualizes spending patterns, and generates smart insights, built to industry standard with real data persistence.
Year :
Year :
2026
2026
Industry :
Industry :
Fintech/Personal Finance
Fintech/Personal Finance
Client :
Client :
Personal Project
Personal Project
Project Duration :
Project Duration :
2 weeks
2 weeks
Introduction:
FinFlow is a production-grade personal finance dashboard I built entirely from scratch using React. The idea came from a simple frustration - most budgeting apps are either too complex or locked behind subscriptions. I wanted to build something clean, fast, and genuinely useful that I could also use to demonstrate real frontend engineering skills.
The app runs entirely in the browser with no backend required. All data persists in localStorage, charts update in real time, and the insights engine automatically analyzes your spending patterns month over month.
Challenge:
The main technical challenge was building a meaningful analytics engine without a database or backend. All calculations - month-over-month comparisons, spending forecasts, category breakdowns and savings rate tracking - had to be derived on the fly from raw transaction data using pure JavaScript.
A secondary challenge was making the data visualization feel genuinely useful rather than decorative. Every chart answers a specific question a real user would ask.
features:
Dashboard: Monthly stat cards with trend deltas, 6-month income vs expenses area chart, top spending categories, and savings rate tracker.
Transactions: Full add, edit, and delete with search, filter by category and type, sort by date or amount, pagination, and one-click CSV export.
Analytics: Five charts including spending breakdown by category, cumulative net cash flow, monthly savings rate with a 20% target line, and a 3-month expense forecast.
Smart Insights: Auto-generated plain-English insights like "You spent 34% more on food this month" or "Fridays are your most expensive day of the week."
Budget: Per-category monthly limits with inline editing, visual progress bars, over-budget alerts, and a month-over-month comparison table.
tech stack:
React 18: Functional components and hooks throughout, no class components.
Recharts: All data visualizations. Chose this over D3 for its declarative React-native API.
date-fns: Date manipulation for all analytics calculations.
Vite: Build tool and dev server.
CSS Variables: Full design token system. No CSS framework used - everything custom.
localStorage: Client-side persistence. Swapping this for a real API would only require changing the useFinance hook.
process:
I started by designing the data model - a single transactions array with type, category, amount, date, and recurring flag. Everything else in the app is derived from that.
I built the analytics utility functions first before writing any UI, which made each component easy to build since the hard logic was already tested in isolation.
The design direction was a dark editorial theme - financial tools are used for extended periods so dark mode reduces eye strain, and it makes numbers and charts visually pop against the background.
The seed data includes 70+ realistic Canadian transactions across 3 months so the app is fully populated and usable immediately when someone opens it.
results:
Fully working app deployed on Vercel with a live URL. Every feature works end to end - add a transaction and every chart, insight, and budget tracker updates instantly. The CSV export, search, filters, and pagination all work on real data.
The codebase is structured the way a real team project would be - separated into components, hooks, and utilities - so it demonstrates not just that I can write React, but that I can organize it properly.
conclusion:
This project taught me how much you can do with just React and a well-designed data layer. The analytics engine - which generates insights, forecasts, and health scores - is entirely pure functions operating on a plain array. No library, no backend, no magic.
If I were to extend this, the next step would be Plaid API integration for automatic bank imports, which would turn this from a manual tracker into a fully automated dashboard.
What I'd Do Differently:
I'd add proper unit tests for the analytics functions from the start - they're the core of the app and the most likely place for bugs to hide as the codebase grows.
I'd also explore a lightweight backend (Supabase or Firebase) to enable multi-device sync, which is the one thing localStorage can't do.